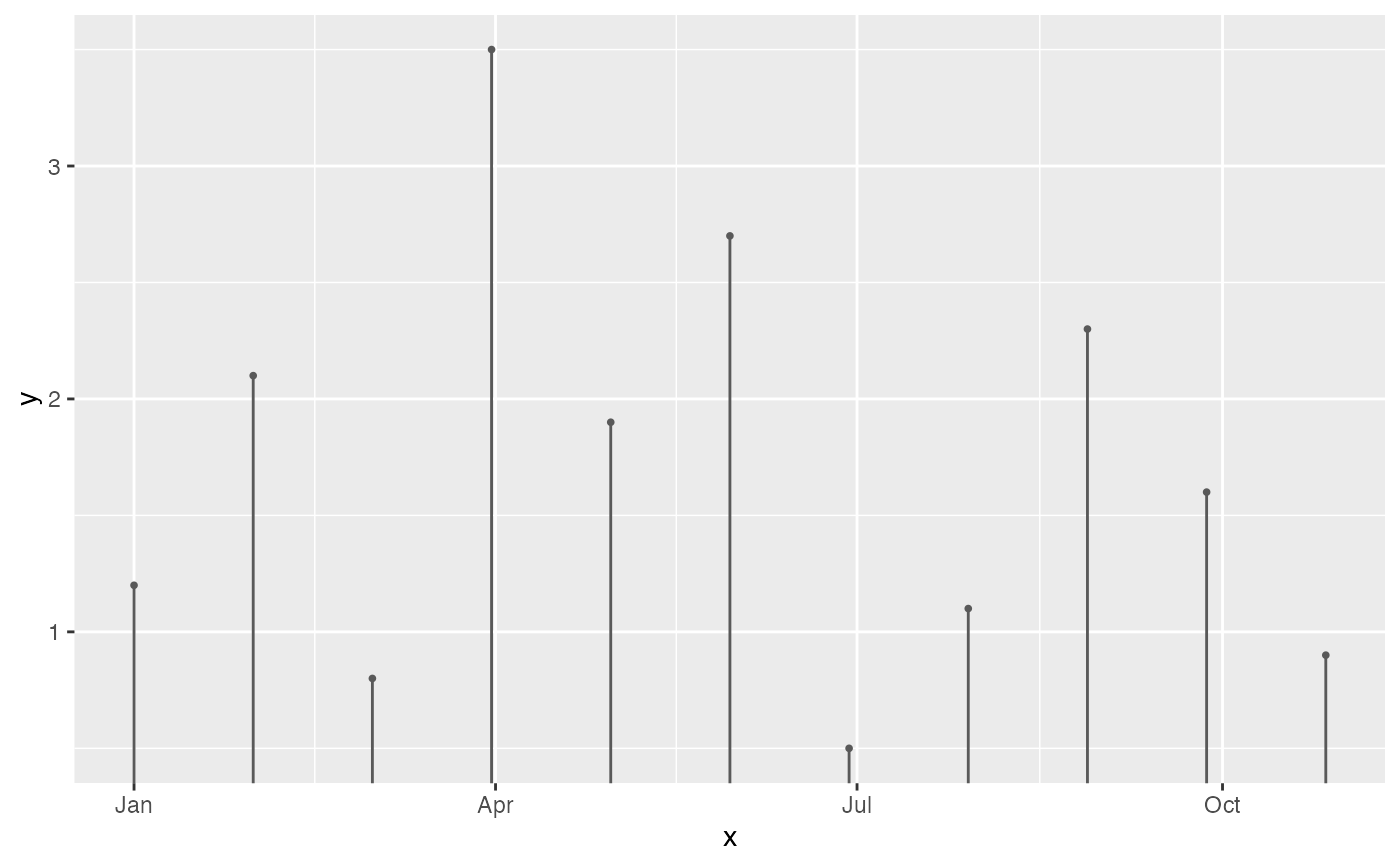
A ggplot2 geom that draws lollipop (stem + point) plots for event metrics.
Usage
geom_lolli3(
  mapping = NULL,
  data = NULL,
  stat = "identity",
  position = "identity",
  ...,
  na.rm = FALSE,
  show.legend = NA,
  inherit.aes = TRUE
)
Arguments
- mapping
Aesthetic mappings. Requires
xandy.- data
The data to display.
- stat
Statistical transformation. Default
"identity".- position
Position adjustment. Default
"identity".- ...
Additional arguments.
- na.rm
Remove NAs? Default
FALSE.- show.legend
Show legend? Default
NA.- inherit.aes
Inherit aesthetics? Default
TRUE.
Details
Each lollipop is drawn independently from its own row – unlike
geom_flame3, nothing here depends on row order or grouping
within a series. For depth-resolved data, map depth to colour
(or shape) to distinguish levels, or use
ggplot2::facet_wrap(~ depth); both work with the standard ggplot2
aesthetics and need no special handling from this geom.