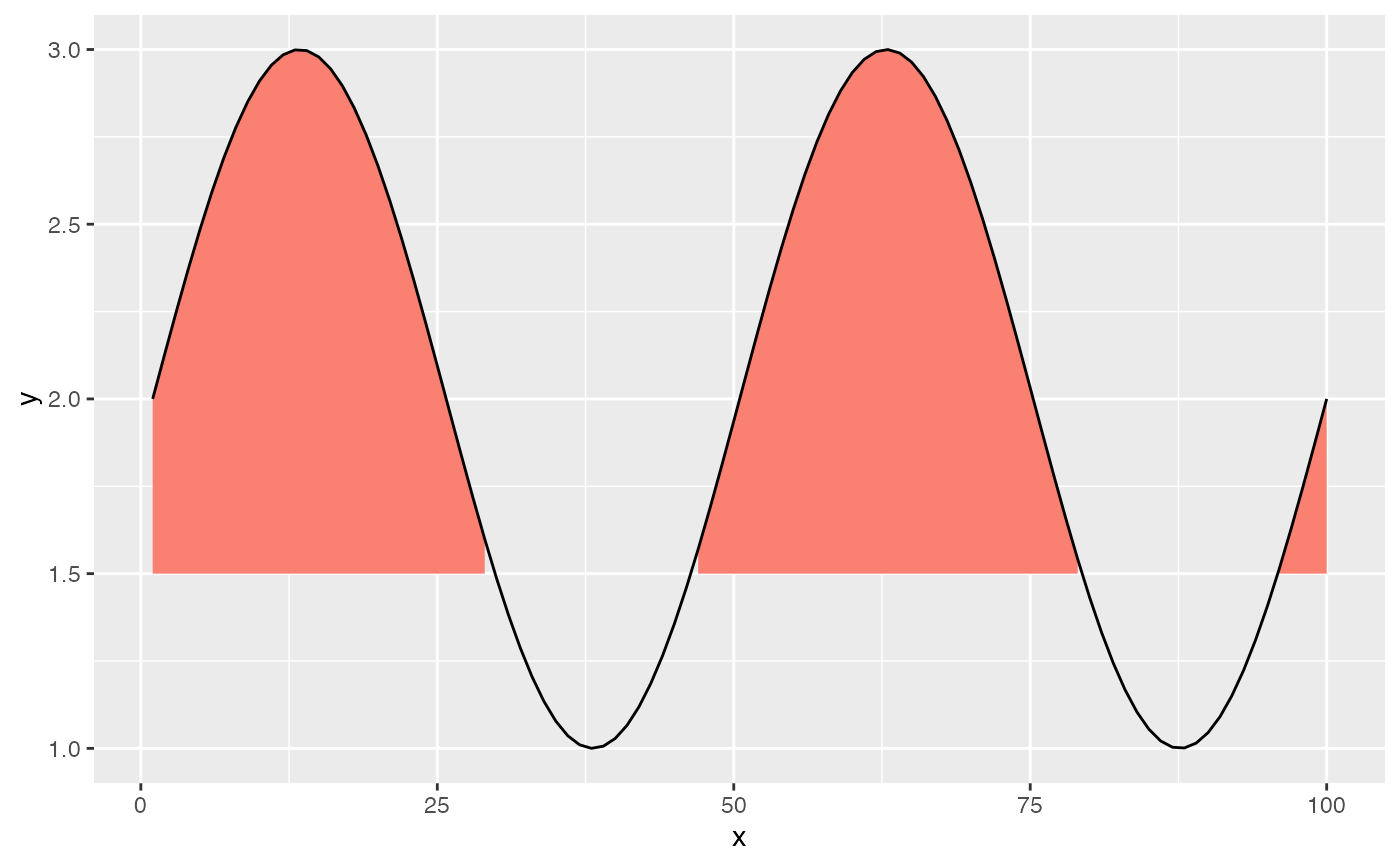
A ggplot2 geom that fills the area between two lines (temperature and
threshold) where the first exceeds the second, creating "flame" polygons.
For cold-spells, set reverse = TRUE to fill where y < y2.
Usage
geom_flame3(
  mapping = NULL,
  data = NULL,
  stat = "identity",
  position = "identity",
  ...,
  n = 0,
  n_gap = 0,
  reverse = FALSE,
  na.rm = FALSE,
  show.legend = NA,
  inherit.aes = TRUE
)
Arguments
- mapping
Set of aesthetic mappings. Requires
x,y, andy2. An optionaldepthaesthetic can be mapped for depth-resolved data (see Details).- data
The data to display.
- stat
The statistical transformation. Default
"identity".- position
Position adjustment. Default
"identity".- ...
Additional arguments passed to the layer.
- n
Minimum number of consecutive exceeding points. Default
0.- n_gap
Maximum gap to bridge between exceeding segments. Default
0.- reverse
Logical. If
TRUE, fill wherey < y2(for cold-spells). DefaultFALSE(fill wherey > y2).- na.rm
Remove NAs? Default
FALSE.- show.legend
Show legend? Default
NA.- inherit.aes
Inherit aesthetics from the plot? Default
TRUE.
Details
geom_flame3() finds exceedance runs by walking each group's rows in
order, so a single group must be one continuous series through x.
For depth-resolved data (e.g. hw3_export() on a
ts2clm3(depth_range = ...) product), map depth as an
aesthetic – aes(x = t, y = temp, y2 = thresh, depth = depth) –
and it is automatically folded into the row grouping, so each depth level
gets its own exceedance runs instead of being treated as one series with
depths interleaved. This happens even though depth is a plain
numeric column, which ggplot2's own default grouping would otherwise merge
into a single group (unlike a discrete aesthetic such as colour).