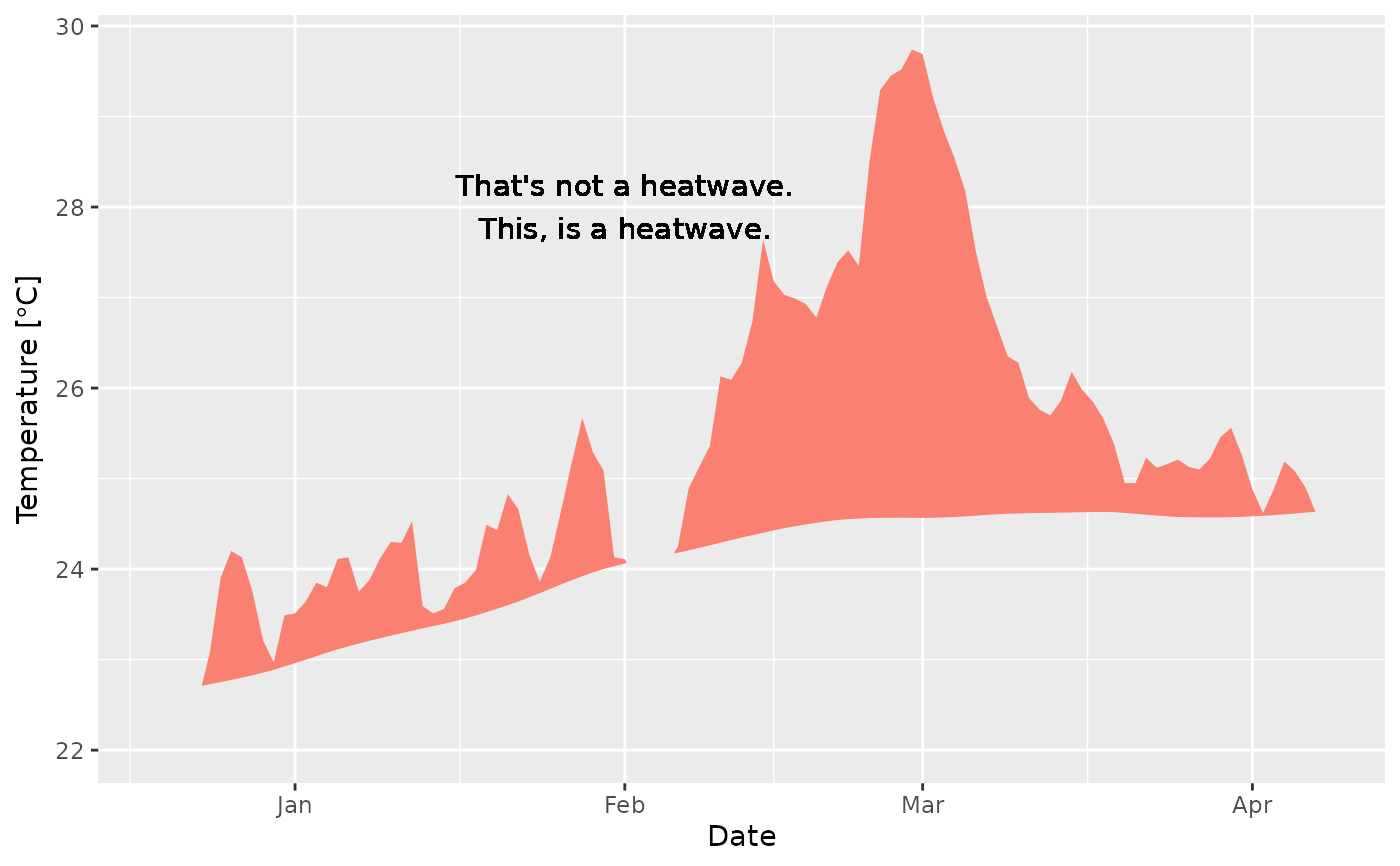
This function will create polygons between two lines. If given a
temperature and threshold time series, like that produced by
detect_event, the output will meet the specifications
of Hobday et al. (2016) shown as 'flame polygons.' If one wishes to
plot polygons below a given threshold, and not above, switch the values
being fed to the y and y2 aesthetics. This function differs
in use from event_line in that it must be created as a
ggplot 'geom' object. The benefit of this being that one may add
additional information to the figure as geom layers to ggplot2 graphs
as may be necessary.
Usage
geom_flame(
  mapping = NULL,
  data = NULL,
  stat = "identity",
  position = "identity",
  ...,
  n = 0,
  n_gap = 0,
  na.rm = FALSE,
  show.legend = NA,
  inherit.aes = TRUE
)
Arguments
- mapping
Set of aesthetic mappings created by
aes()oraes_(). If specified and inherit.aes = TRUE (the default), it is combined with the default mapping at the top level of the plot. You must supply mapping if there is no plot mapping.- data
The data to be displayed in this layer. There are three options:
If NULL, the default, the data is inherited from the plot data as specified in the call to
ggplot().A data.frame, or other object, will override the plot data. All objects will be fortified to produce a data frame. See
fortify()for which variables will be created.A function will be called with a single argument, the plot data. The return value must be a
data.frame, and will be used as the layer data.- stat
The statistical transformation to use on the data for this layer, as a string.
- position
Position adjustment, either as a string, or the result of a call to a position adjustment function.
- ...
other arguments passed on to
layer. These are often aesthetics, used to set an aesthetic to a fixed value, likecolor = "red"orlinewidth = 3. They may also be parameters to the paired geom/stat.- n
The number of steps along the x-axis (i.e. in a daily time series this would be days) required before the area between
yandy2will be filled in. The default of 0 will fill in _all_ of the area between the lines. The standard to match Hobday et al. (2016) isn = 5.- n_gap
The number of steps along the x-axis (i.e. in a daily time series this would be days) within which to allow
geom_flame()to connect polygons. This is useful when one wants to not screen out parts of a polygon that dip only briefly belowybefore coming back up above it. The defauly of 0 will not connect any of the polygons. The standard to match Hobday et al. (2016) isn_gap = 2.- na.rm
If
FALSE(the default), removes missing values with a warning. IfTRUEsilently removes missing values.- show.legend
Logical. Should this layer be included in the legends?
NA, the default, includes if any aesthetics are mapped.FALSEnever includes, andTRUEalways includes. It can also be a named logical vector to finely select the aesthetics to display.- inherit.aes
If
FALSE, overrides the default aesthetics, rather than combining with them. This is most useful for helper functions that define both data and aesthetics and shouldn't inherit behaviour from the default plot specification, e.g.borders().
Aesthetics
geom_flame understands the following aesthetics (required aesthetics
are in bold):
xyy2colourfilllinewidthalphalinetype
References
Hobday, A.J. et al. (2016), A hierarchical approach to defining marine heatwaves, Progress in Oceanography, 141, pp. 227-238, doi: 10.1016/j.pocean.2015.12.014
See also
event_line for a non-ggplot2 based flame function.
Examples
ts <- ts2clm(sst_WA, climatologyPeriod = c("1983-01-01", "2012-12-31"))
res <- detect_event(ts)
mhw <- res$clim
mhw <- mhw[10580:10690,]

library(ggplot2)

ggplot(mhw, aes(x = t, y = temp)) +
  geom_flame(aes(y2 = thresh)) +
  annotate(geom = "text", x = as.Date("2011-02-01"), y = 28,
           label = "That's not a heatwave.\nThis, is a heatwave.") +
  xlab("Date") + ylab(expression(paste("Temperature [", degree, "C]")))