Calculate yearly means for event metrics.
Arguments
- data
Accepts the data returned by the
detect_eventfunction.- x
This column is expected to contain a vector of dates as per the specification of
ts2clm. If a column headedtis present in the dataframe, this argument may be omitted; otherwise, specify the name of the column with dates here.- y
This is a column containing the measurement variable. If the column name differs from the default (i.e.
temp), specify the name here.- report
Specify either
fullorpartial. Selectingfullcauses the report to contain NAs for any years in which no events were detected (except forcount, which will be zero in those years), whilepartialreports only the years wherein events were detected. The default isfull.- returnDF
The default (
TRUE) tells the function to return the results as typedata.frame.FALSEwill return the results as adata.table.
Value
The function will return a data frame of the averaged (or aggregate) metrics. It includes the following:
- year
The year over which the metrics were averaged.
- count
The number of events per year.
- duration
The average duration of events per year [days].
- duration_max
The maximum duration of an event in each year [days].
- intensity_mean
The average event "mean intensity" in each year [deg. C].
- intensity_max
The average event "maximum (peak) intensity" in each year [deg. C].
- intensity_max_max
The maximum event "maximum (peak) intensity" in each year [deg. C].
- intensity_var
The average event "intensity variability" in each year [deg. C].
- intensity_cumulative
The average event "cumulative intensity" in each year [deg. C x days].
- rate_onset
Average event onset rate in each year [deg. C / days].
- rate_decline
Average event decline rate in each year [deg. C / days].
- total_days
Total number of events days in each year [days].
- total_icum
Total cumulative intensity over all events in each year [deg. C x days].
intensity_max_relThresh, intensity_mean_relThresh,
intensity_var_relThresh, and intensity_cumulative_relThresh
are as above except relative to the threshold (e.g., 90th percentile) rather
than the seasonal climatology.
intensity_max_abs, intensity_mean_abs, intensity_var_abs, and
intensity_cumulative_abs are as above except as absolute magnitudes
rather than relative to the seasonal climatology or threshold.
Details
This function needs to be provided with the full output from the detect_event
or exceedance functions. Note that the yearly averages are calculated only for
complete years (i.e. years that start/end part-way through the year at the beginning
or end of the original time series are removed from the calculations).
This function differs from the python implementation of the function of the
same name (i.e., blockAverage, see https://github.com/ecjoliver/marineHeatWaves)
in that we only provide the ability to calculate the average (or aggregate)
event metrics in 'blocks' of one year, while the python version allows
arbitrary (integer) block sizes.
Note that if this function is used on the output of exceedance, all of the metrics
(see below) with relThresh in the name will be returned as NA values.
References
Hobday, A.J. et al. (2016), A hierarchical approach to defining marine heatwaves, Progress in Oceanography, 141, pp. 227-238, doi: 10.1016/j.pocean.2015.12.014
Examples
ts <- ts2clm(sst_WA, climatologyPeriod = c("1983-01-01", "2012-12-31"))
res <- detect_event(ts)
out <- block_average(res)
summary(glm(count ~ year, out, family = "poisson"))
#>
#> Call:
#> glm(formula = count ~ year, family = "poisson", data = out)
#>
#> Coefficients:
#>              Estimate Std. Error z value Pr(>|z|)
#> (Intercept) -63.70416   20.29044  -3.140  0.00169 **
#> year          0.03209    0.01011   3.173  0.00151 **
#> ---
#> Signif. codes:  0 ‘***’ 0.001 ‘**’ 0.01 ‘*’ 0.05 ‘.’ 0.1 ‘ ’ 1
#>
#> (Dispersion parameter for poisson family taken to be 1)
#>
#>     Null deviance: 116.78  on 40  degrees of freedom
#> Residual deviance: 106.27  on 39  degrees of freedom
#> AIC: 176.77
#>
#> Number of Fisher Scoring iterations: 6
#>

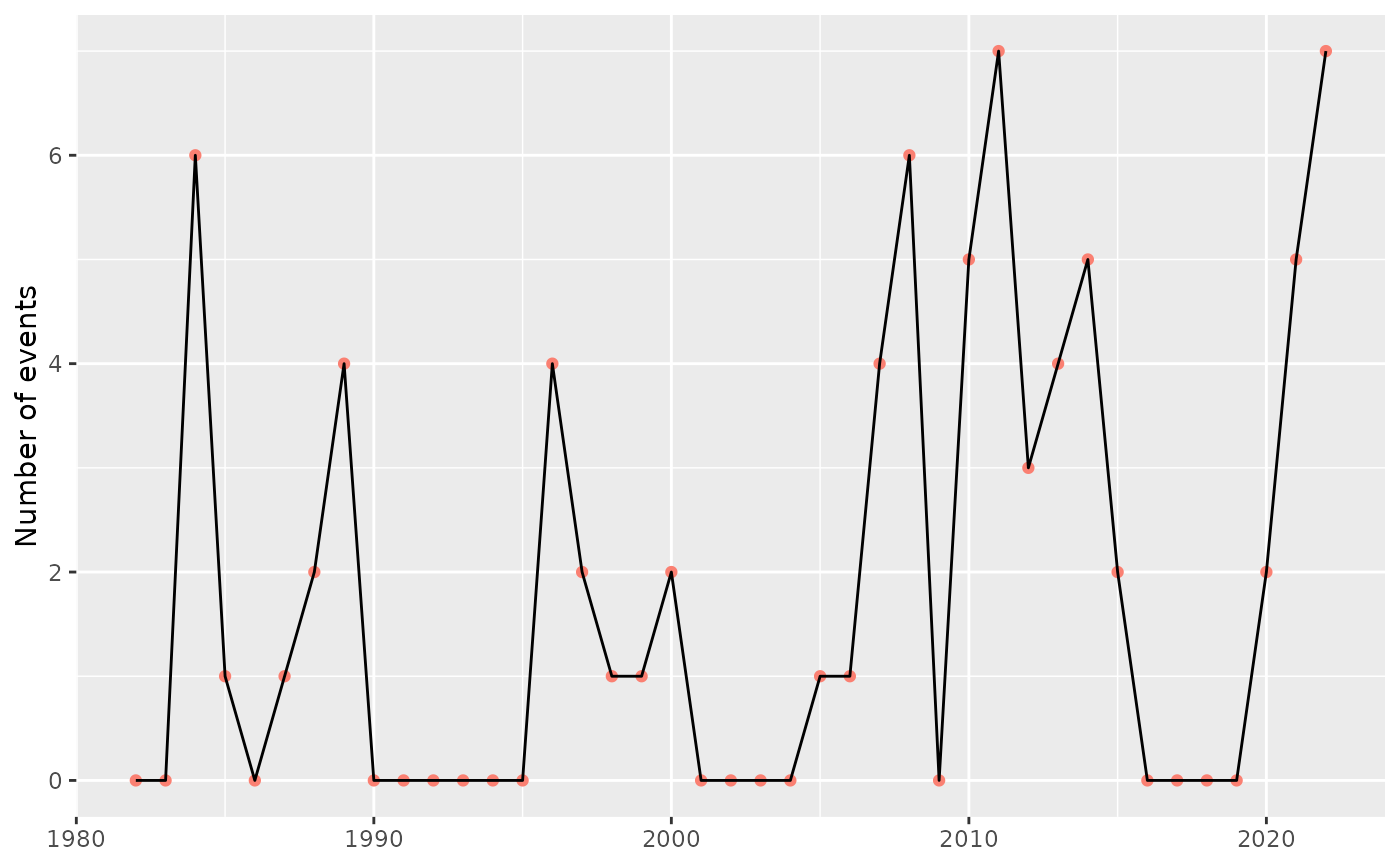
library(ggplot2)

ggplot(data = out, aes(x = year, y = count)) +
  geom_point(colour = "salmon") +
  geom_line() +
  labs(x = NULL, y = "Number of events")

